It’s predicted that by 2025 we will reach 175 zettabytes of data created worldwide. For reference, one zettabyte stores as much information as 33 million human brains. Seeing such a figure, it can be hard to wrap around our heads just how much data is available to us, let alone be able to scratch its surface.
That’s why the creator of the Instagram account “We Have The Data” does their best to find and share data visualizations that present big amounts of information in an easy-to-understand and aesthetically pleasing way. Scroll down to find their best posts and make sure to upvote the ones that you find the most enlightening.
#1

Image source: matt_gray_
#2

Image source: wehavethedata
#3

Image source: artisanrocky
#4

Image source: historyinmemes
#5

Image source: AlecStapp
#6

Image source: Rainmaker1973
#7

Image source: wehavethedata
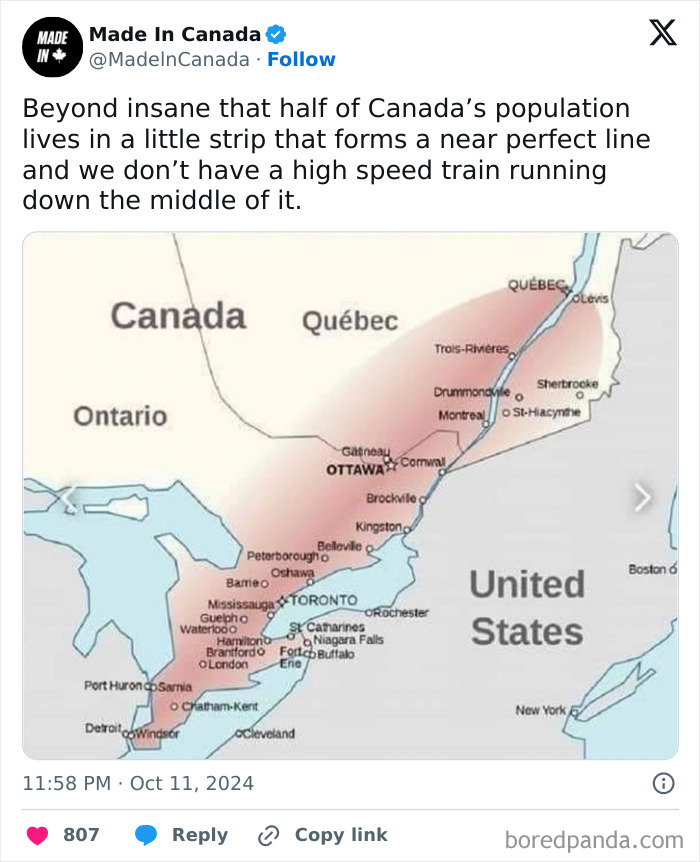
#8

Image source: MadelnCanada
#9
“The journey of an Arctic Fox who walked from Norway to Canada in 2018”

Image source: wehavethedata
#10

Image source: Rainmaker1973
#11

Image source: JamesLucasIT
#12

Image source: amazingmap
#13

Image source: wehavethedata
#14

Image source: tanayj
#15

Image source: Noahpinion
#16
“The Amazon River and its tributaries”

Image source: wehavethedata
#17

Image source: WarMonitors
#18

Image source: scienceisstrat1
#19
“Uptown, midtown, downtown of Toronto”

Image source: wehavethedata
#20

Image source: wehavethedata
#21

Image source: wehavethedata
#22

Image source: BrilliantMaps
#23
“Tracking of an eagle over a 20 year period”

Image source: wehavethedata
#24

Image source: waitbutwhy
#25
“The easternmost point of Brazil is closer to Africa than to its westernmost point”

Image source: wehavethedata
#26

Image source: MAstronomers
#27
“A cool guide showing you the various patterns of black and white or tuxedo cats”

Image source: wehavethedata
#28

Image source: erikphoel
#29
“The numbers 0-99 sorted alphabetically in different languages”

Image source: wehavethedata
#30

Image source: tradingMaxiSL
 Follow Us


