Beauty is in the eye of the beholder, and we all have our own ideas of what can be considered stunning. For some, a bright orange sunset is the epitome of beauty, while others can’t imagine anything more gorgeous than a perfectly baked soufflé. Even charts can be considered beautiful by the right audience.
So if you’re a graph enthusiast, you’re in luck. Down below, we’ve gathered some of the most gorgeous and satisfying displays of information that have been shared on the “Data is Beautiful” subreddit. Enjoy learning something new from these stunning charts, be sure to upvote the ones you find equally informative and aesthetically pleasing!
#1 Countries With School Shootings (Total Incidents From Jan 2009 To May 2018)

Image source: flyingcatwithhorns
#2 Bloom Dates For Every Flower In My Garden- Everyone In R/Gardening Wanted Me To Share This Here, Hope You’ll Allow It!

Image source: M-Rage
#3 Gordon Ramsay And Martha Stewart Are Being Outperformed By Doña Angela, A Grandma From Rural Mexico And Her Daughter’s Phone Camera

Image source: latinometrics
#4 Abortion Deaths In The USA (1968-2018)

Image source: thedataracer
#5 [oc] I Updated Our Famous Password Table For 2022

Image source: hivesystems
#6 USA Cigarettes Sold V. Lung Cancer Death Rates

Image source: rosetechnology
#7 Japan’s Work To Reduce Homelessness

Image source: Xsythe
#8 Young Adults Are Leading The Mass Exodus From Christianity In The Us

Image source: gridnews
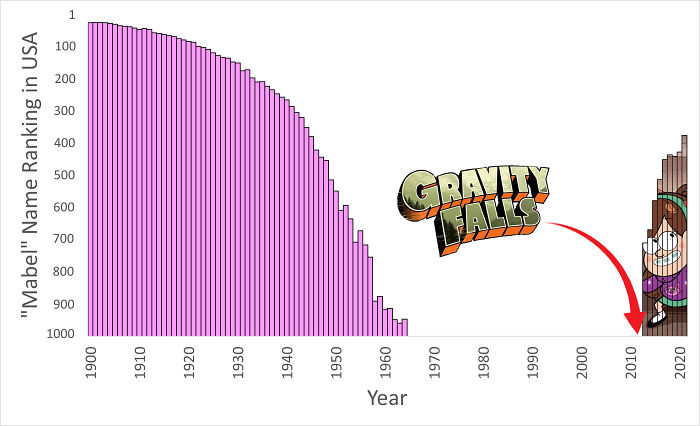
#9 The Popularity Of The Name “Mabel” In The United States Skyrocketed After Gravity Falls Came Out

Image source: Aloiciousss
#10 Costco Hot Dog Combo vs. Inflation

Image source: nick_ecoinometrics
#11 Population Density Of Egypt

Image source: symmy546
#12 Bolivia’s Infant Mortality Has Dropped Below The World’s Average

Image source: latinometrics
#13 What Would Minimum Wage Be If…?

Image source: LibertarianSlaveownr
#14 Titanic Survival By Gender And Class. Learning R For The First Time And The Power Of Ggplot

Image source: Junior-Obligation-27
#15 Do You Belief In Ghosts?

Image source: GradientMetrics
#16 Frequency Of Compound Insults (E.g. “Poophead”, “Scumwad”) In Reddit Comments, Organized By Prefix And Suffix

Image source: halfeatenscone
#17 Highest Paid Actors For A Single Production

Image source: giteam
#18 Covid-19 Accounted For More Line-Of-Duty Police Deaths Last Year Than All Other Causes Combined

Image source: TrueBirch
#19 Actors/Actresses With The Most Oscar Wins

Image source: giteam
#20 USA: Who Do We Spend Time With Across Our Lifetimes?

Image source: rosetechnology
#21 Does Healthcare Spending Correlate With Life Expectancy?

Image source: latinometrics
#22 What Foreign Ways Of Doing Things Would Americans Embrace?

Image source: YouGov_Official
#23 Global Wealth Inequality In 2021 Visualized By Comparing The Bottom 80% With Increasingly Smaller Groups At The Top Of The Distribution

Image source: rubenbmathisen
#24 Most Spoken Languages In The World

Image source: neilrkaye
#25 What Job Hunting Has Been Like As A 2020 Graduate So Far

Image source: Abbathor
#26 World’s Biggest Polluters

Image source: infographycs
#27 Household Ownership Of Consumer Goods In India

Image source: pratapvardhan
#28 Surge In Egg Prices In The U.s

Image source: Metalytiq
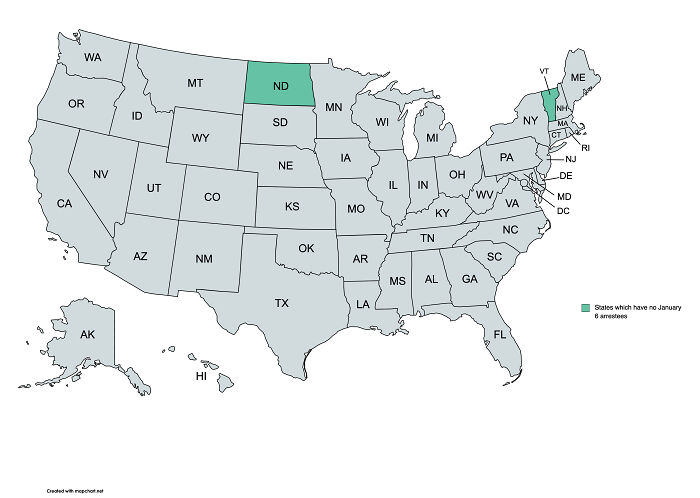
#29 Us States Which Do Not Have Residents Arrested For January 6 Offences

Image source: Negative12DollarBill
#30 2 Years Of My GF And I Tracking The Sleep Quality Impact Of Various Choices/Behaviours. These Were The 8 Most Significant Effects

Image source: HeroJournal
#31 Single Line Drawn Through All Zip Codes In Numerical Order

Image source: fuckverilog
#32 The Most Watched Netflix Shows

Image source: Dremarious
#33 Size Of Bank Failures Since 2000

Image source: pranshum
#34 How Probable Is ……?

Image source: GradientMetrics
#35 A Comparison Of Nato And Russia’s Military Strength

Image source: arshadejaz
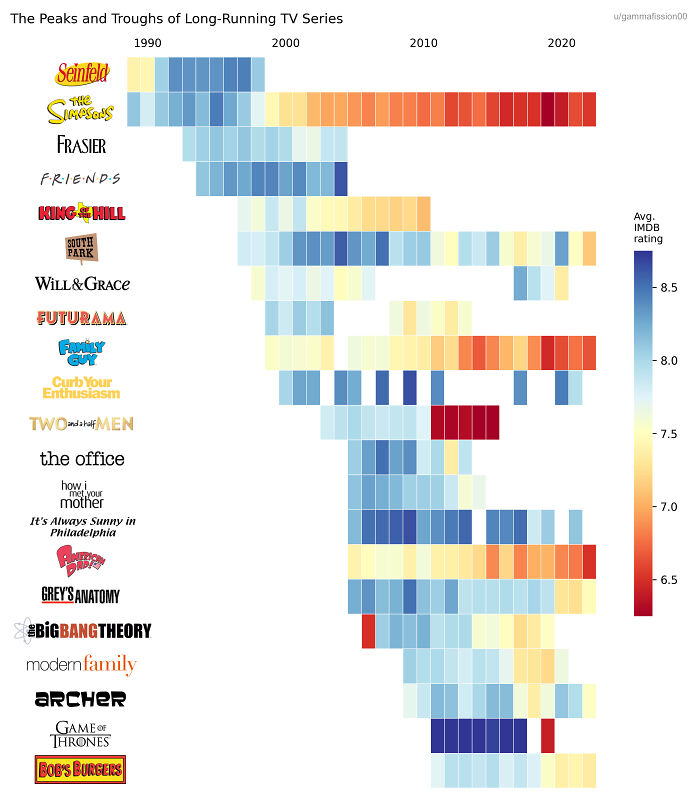
#36 The Peaks And Troughs Of Long-Running TV Series

Image source: gammafission00
#37 The Absolute Quality Of Better Call Saul

Image source: SansAtionel
#38 I Recorded The Race Of All 433 Actors In The 2022 Super Bowl Commercials. Here’s How They Compare To The Actual Us Population

Image source: TheBigBo-Peep
#39 Richest Billionaire In Each State

Image source: Dremarious
#40 World Population 2023 In A Single Chart Calculate In Millions Of People. China, India, The Us, And The Eu Combined Generate Half Of The World’s Gdp And Are Home To Almost Half Of The World’s Population

Image source: maps_us_eu
 Follow Us


